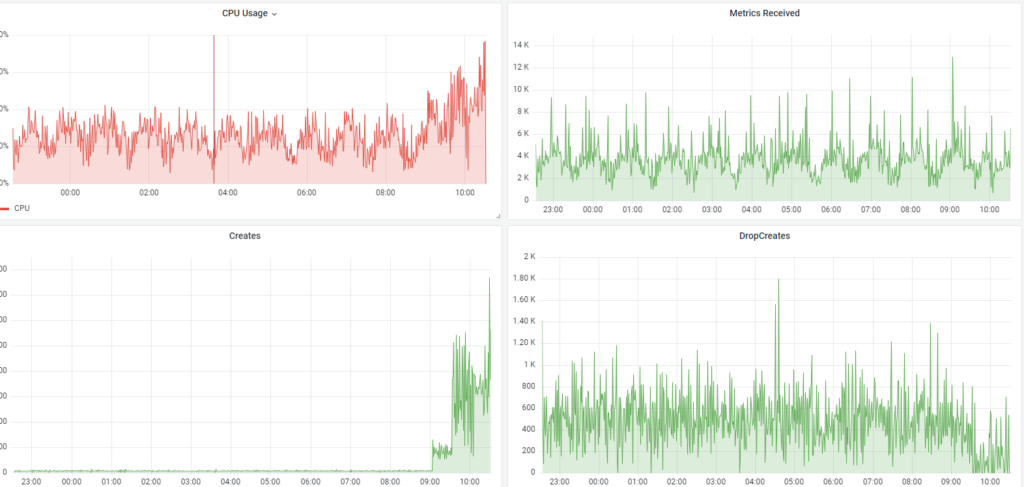
We use Graphite to store time series metrics for Sitespeed run result. Each of Sitespeed page result data contains more than 500 metrics. It’s interesting that we only see the metrics after a few days. We checked all the logs and don’t see any network issues. We only see the root cause when we built a dashboard to see some graphites internal metrics.

As you can see , the number of metrics created was very low while the drop was very high? Why there are so many drops? It turns out that in graphite we have a configure
# Softly limits the number of whisper files that get created each minute.
# Setting this value low (e.g. 50) is a good way to ensure that your carbon
# system will not be adversely impacted when a bunch of new metrics are
# sent to it. The trade off is that any metrics received in excess of this
# value will be silently dropped, and the whisper file will not be created
# until such point as a subsequent metric is received and fits within the
# defined rate limit. Setting this value high (like "inf" for infinity) will
# cause carbon to create the files quickly but at the risk of increased I/O.
MAX_CREATES_PER_MINUTE = 50
So, it only create 50 metrics per minutes – that’s too low. Our tool send the metrics in every hour, so technically it only create 50 new metrics per hour. I think the 50 value is only good for system update very often like every minute, so it will not overwhelm your system.
I finally increase the number to 5000 , we got a high cpu usage at some points but it went down after that.
So to have an optimize number for MAX_CREATES_PER_MINUTE , you need to balance between how often you update and how much your server capacity can handle.