Archives for General - Page 2
What’s the Deal with That 32GB NVMe in My HP 880 Gaming PC?
I recently picked up an older HP 880 gaming desktop and noticed something odd: it came with a 32GB NVMe drive pre-installed, and no other storage device was present....
My First Visit to Harpers Ferry
This was my first visit to Harpers Ferry. Before coming, I tried to find some brief information about the area, but most of it wasn’t very helpful. So, I...
Splunk: Setting up Universal Forwarder
mkdir /opt/splunkforwarderuseradd -m splunk cd /opt/splunkforwarder wget -O “#8221;dpkg -i chown -R splunk:splunk /opt/splunkforwarder /opt/splunkforwarder/bin/splunk start cd etc/system/local/nano nano sudo systemctl restart sudo systemctl...
Simplifying Home Web Hosting with Cloudflare Zero Trust
In the past, hosting a website from your own home required a fair amount of technical know-how and came with significant security risks. Traditional setups involved several key steps:...
Monitoring and Alerting Best Practices
1. Avoid Relying Solely on Email for Alerts Email is not a reliable alerting mechanism. Alerts can be delayed, filtered as spam, or ignored due to cluttered inboxes. From...
Canon 5D Mark III vs 5D Mark IV
I just bought a Canon 5D Mark IV. I had 5D Mark III before, here are new features that i like on Mark IV
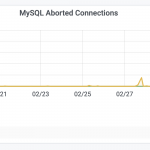
Monitoring Mysql server – aborted clients
We mostly care about the cpu/memory/storage metrics for mysql. I found another interesting metrics, it’s the aborted clients. What is it? It’s the number of the client is unable...
Cloudflare: You save my day
We recently got a spike in the requests, all the requests are coming from Alibaba IP address space. We are not sure what the purpose of this request is,...


